
Benchmark Suite Results
MLPerf Endpoints
v1.0 Submissions Now Open
MLPerf Endpoints is an open benchmarking framework that characterizes complete system performance for real world AI inference. Intuitive visuals show the full performance profile under varying workloads, not just for one optimized case. Results are peer reviewed and audited to ensure there is no bias, and posted on a continuous basis as soon as available.
Made for Buyers – Endpoints provides real world insights into actual production performance and costs for buyers as it tests AI performance exactly how it is actually consumed: via live API endpoints.
Used by Providers – AI infrastructure providers can generate intuitive visuals that clearly showcase their solutions, uses and benefits for development and marketing purposes.
The MLPerf LoadStairs Visual
Visualize results of every benchmarked system. Each line represents one system, a combination of hardware, software, and a deployed AI model, measured across four critical dimensions:
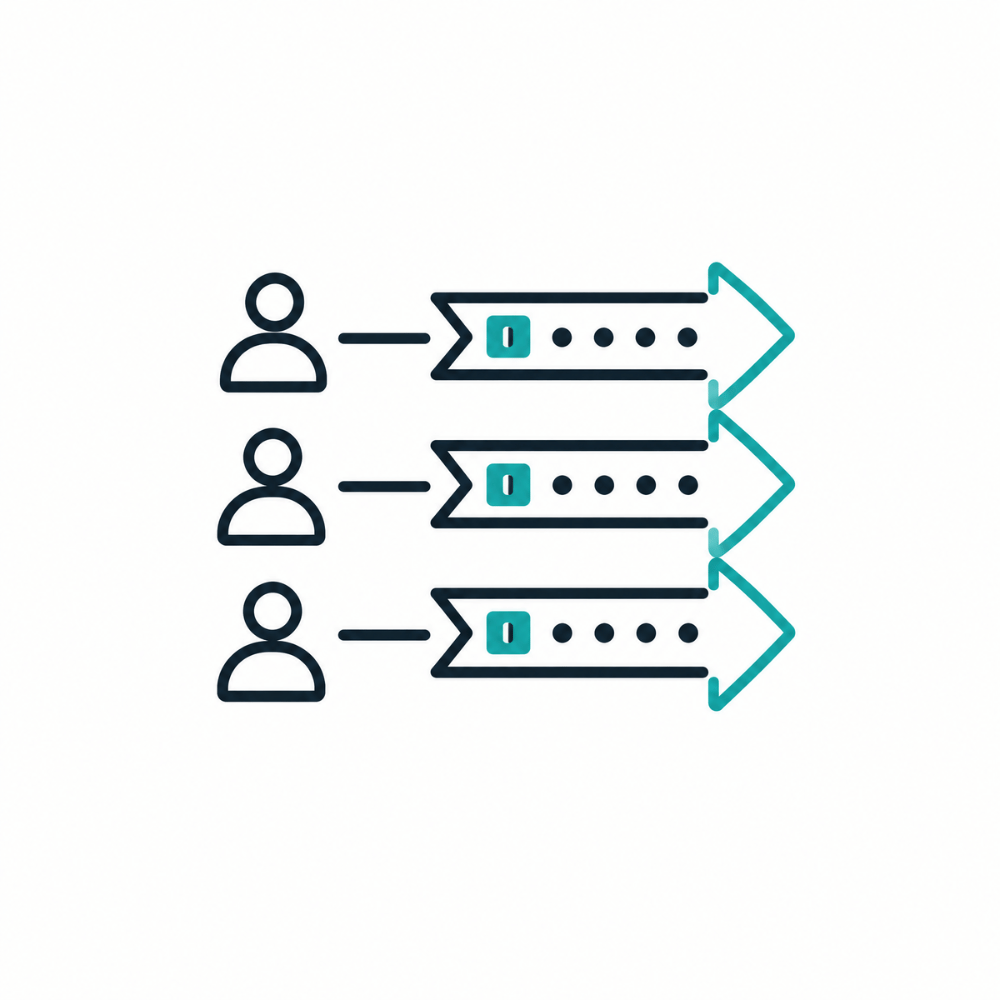
Concurrency is the number of simultaneous queries that the system is sustaining in flight. This roughly corresponds to the number of users.
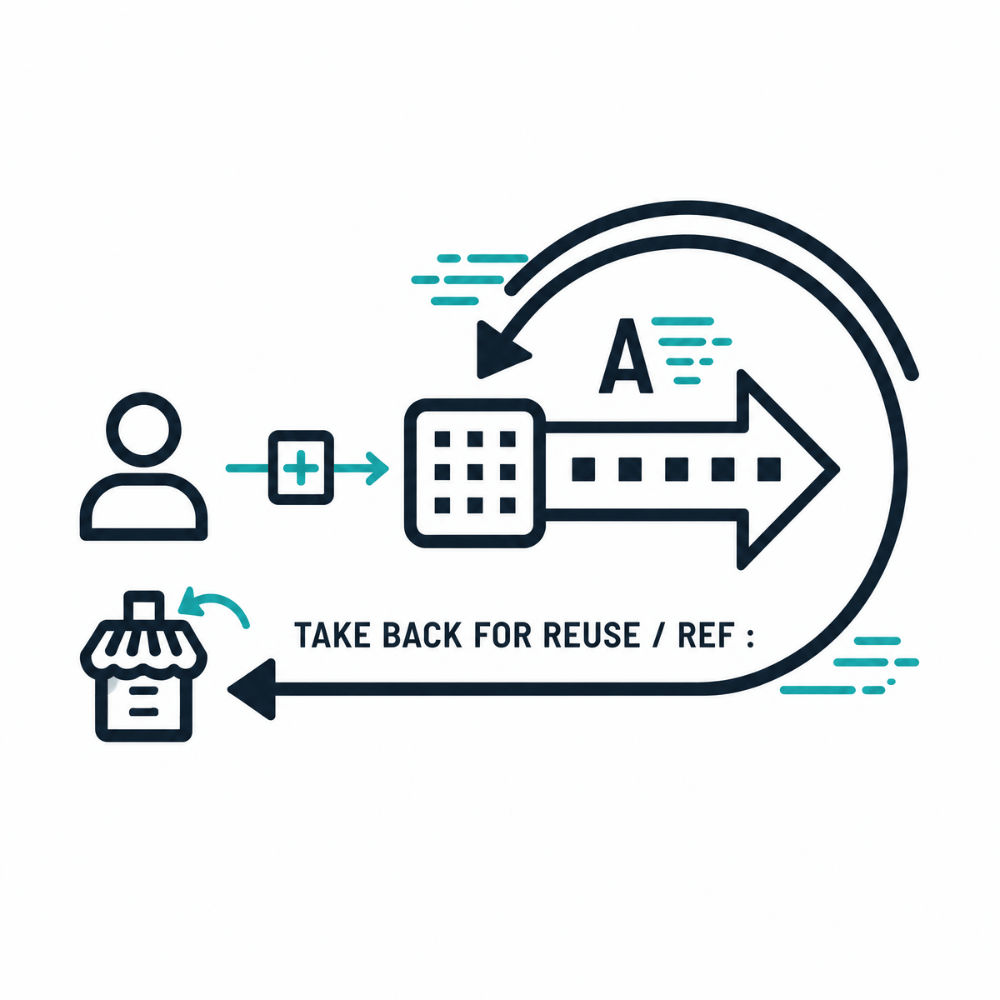
Interactivity is how fast the AI system response streams back to each query measured in tokens per second per user.
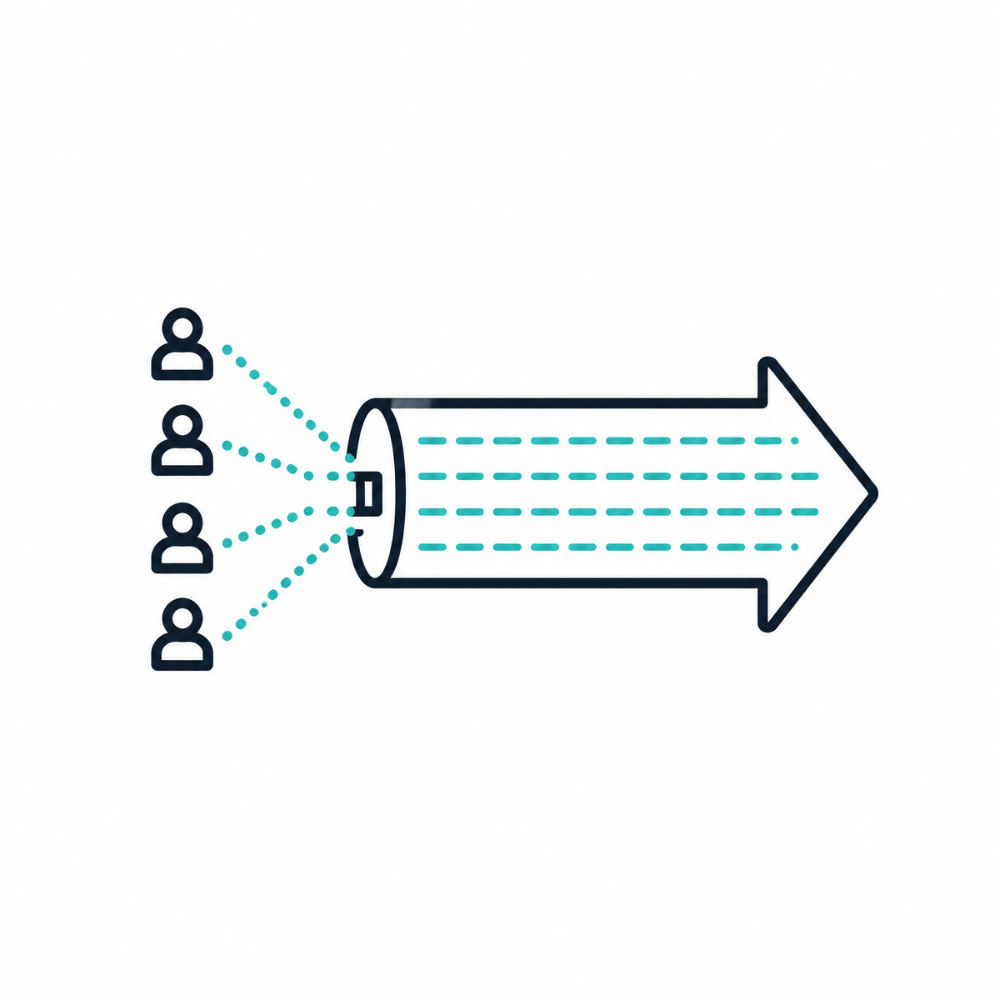
System Throughput or System TPS is the total number of tokens the system produces per second across all users.
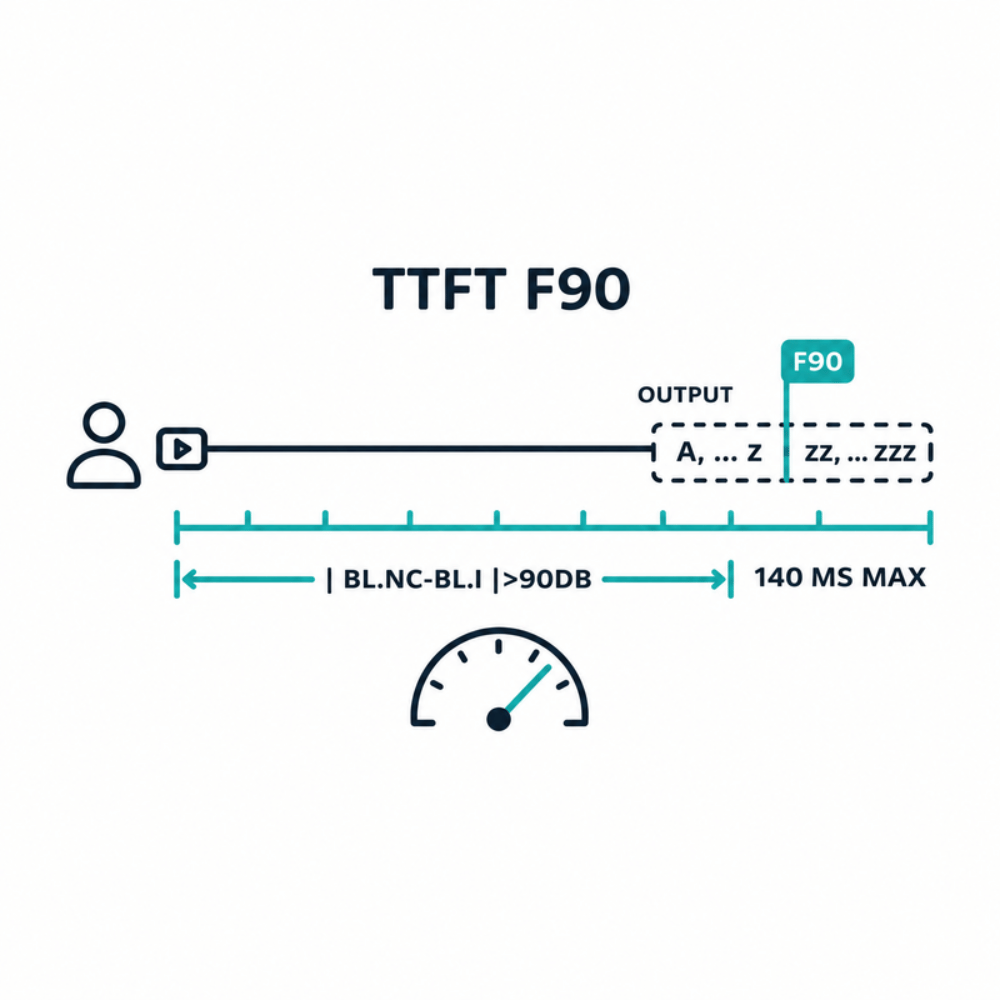
Time to first token P90 (TTFT P90) is the time it takes for the first token (typically a word for an LLM) to come back to the user from a query, measured at the 90th percentile.
Create informative step-line graphs using any metric to analyse system performance, or normalize for power consumption (Throughput per Watt) to compare different systems.
Technical detail
For teams who want to go deeper.
Workloads. The current round measures widely used open models, including GPT-OSS 120B, Llama 3.1 8B, and DeepSeek R1. Each has its own reference implementation and its own accuracy and configuration rules.
How a result is built. A result is a pareto curve, not a single point. A submission includes at least 7 and at most 32 points. Each point runs for at least 600 seconds. Every point uses the same model, endpoint, and software stack, so the curve is internally consistent. Each point may be using a different configuration of the system, e.g., shifting resources from pre-fill to decode. Accuracy is validated for each distinct configuration.
Divisions and status. The standardized division requires model equivalence and full software disclosure with whitebox transparency. Every result is marked verified, provisional, or unverified, and labeled Available, Preview, or RDI.
Peer review and publication. Submitters run the benchmark, register their runs, and open a review request. Reviewers file objections, the submitter responds, and the result is published on a fixed cycle once review is complete. Objections to a published result can be raised later and routed through dispute resolution.
Governance. The rules are set by an open working group that operates by consensus and brings the whole community to the table. The methodology, the rules, and the review process are public.
Normalization. We are actively developing our normalization rules with our community, which we will incorporate into the visualization as soon as they are finalized. If you have a specific request for how you want results to be normalized that would support you in your business decisions, we want to know about it. Please contact us at [email protected].
Links.
- MLPerf Endpoints rules (you will need to sign up here first to see the rules): https://github.com/mlcommons/endpoints_policies
- MLPerf Endpoints examples: https://github.com/mlcommons/endpoints
- Baseline MLPerf Inference rules: https://github.com/mlcommons/inference_policies/blob/master/inference_rules.adoc
- MLPerf submission rules: https://github.com/mlcommons/policies/blob/master/submission_rules.adoc